Reports and ROI: find the funnel leak and the slices that make money
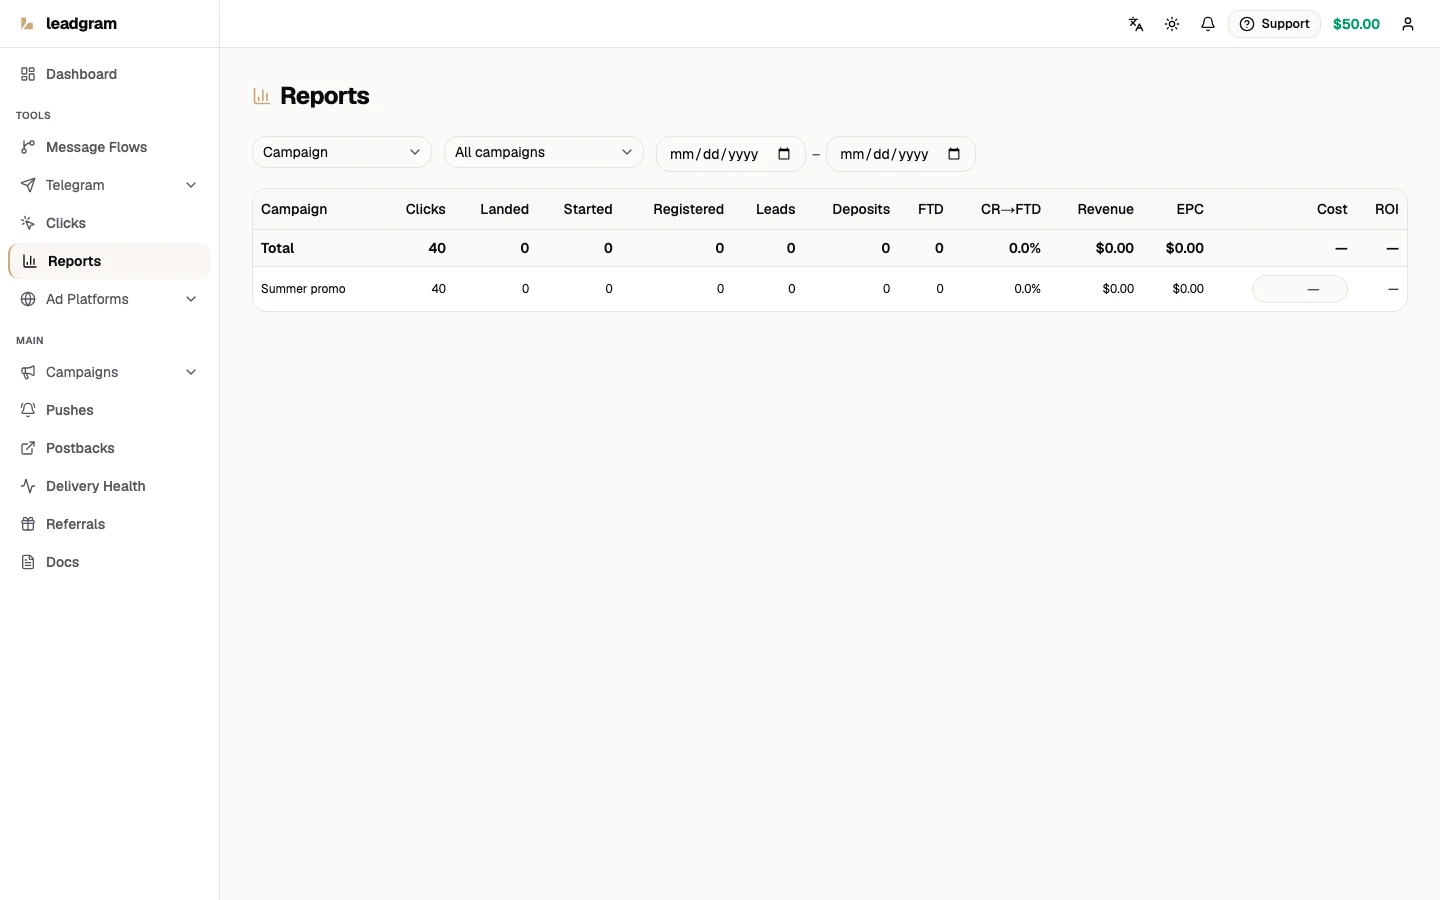
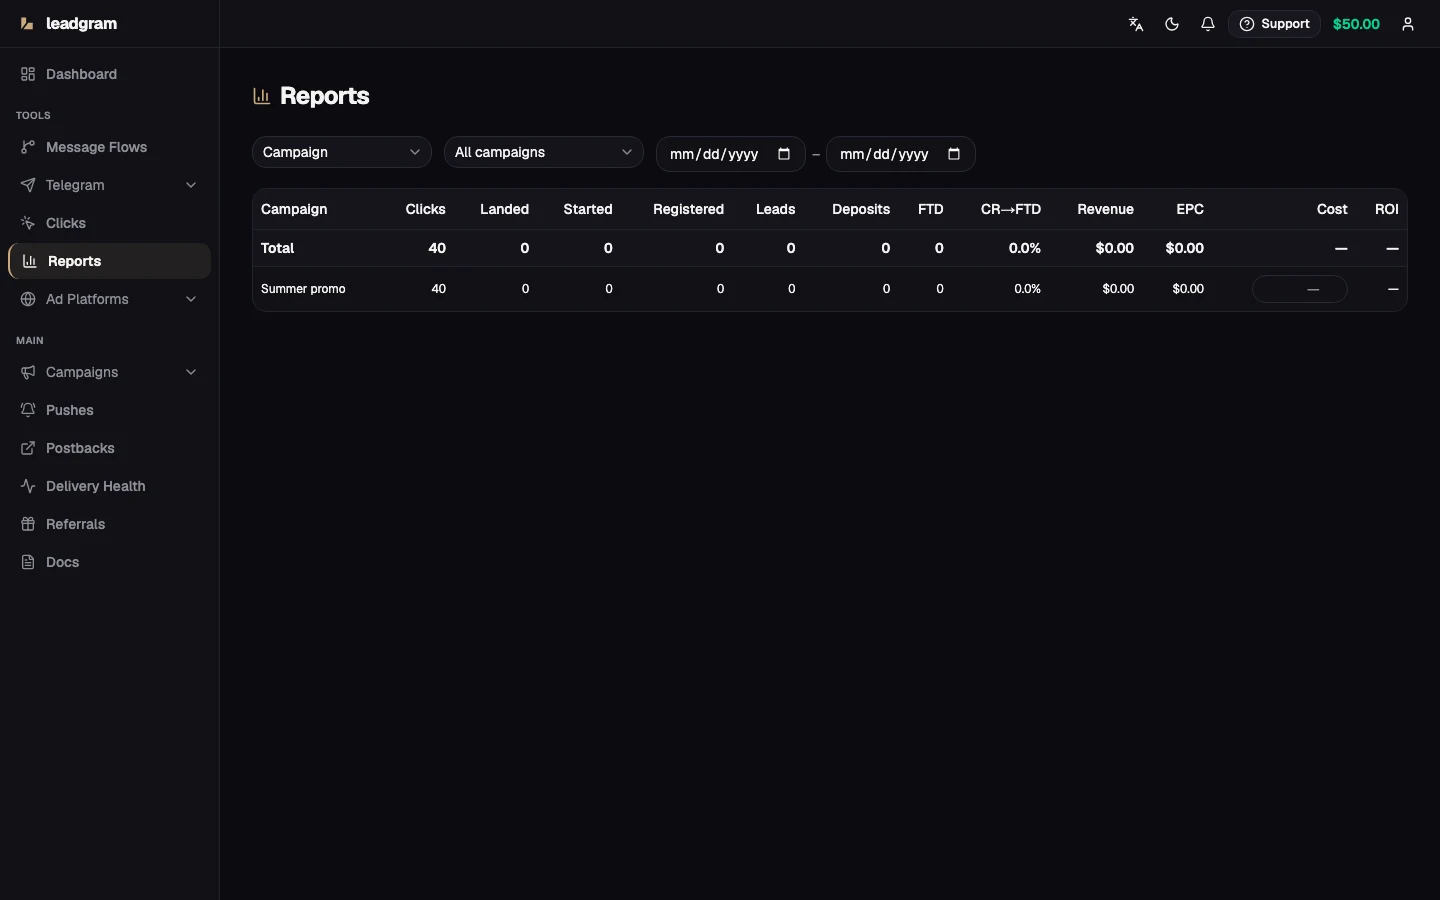
The Reports page pivots every click your campaigns captured into a funnel table, grouped by campaign, geo, sub or day. Revenue, EPC, Cost, ROI and cost per conversion sit right next to the funnel, so deciding what to scale and what to kill is one glance instead of three spreadsheets.
Build a report
- Open Reports and pick a dimension in the group-by selector: Campaign, Geo, Sub1 or Day.
- Scope it with the campaign dropdown ("All campaigns" by default). "Campaign X by geo" is the classic split-test readout.
- Set the date range. Both dates are UTC, and the "to" date includes the whole day.
- Share the URL. All filters live in the query string, so the exact view (dimension, campaign, dates) travels to a teammate as a plain link.
Reading the funnel
Columns go Clicks → Landed → Started → Registered → Leads → Deposits → FTD. Each column counts clicks that reached at least that stage. A click's status only moves forward, so numbers can only shrink left to right, and the biggest drop between two adjacent columns is your leak. CR→FTD is the end-to-end click-to-FTD rate. The Total row is computed by the server over the whole slice, not over the rows on screen. Reports cap at 500 rows sorted by traffic (Day is chronological), so high-cardinality subs show their top slices while the Total still covers all of them.
The leftmost column is the dimension value itself, and it has a null case: clicks with no campaign, no geo, or no sub1 (whichever dimension you're grouped by) collapse into a single "—" row. Day has no such gap, since every click carries a timestamp. That row is real traffic, not a rendering glitch, so don't filter it out of your read.
Revenue and EPC
Revenue is the sum of payouts attached to conversion events of the clicks in each row. The payout arrives with the conversion itself: when your advertiser or your own integration reports a deposit or ftd through the events API, include the payout field and the dollars land in this column. Only events billed as charged or free count. Refunded, blocked, pending and error events are excluded, so a conversion still working its way through the billing pipeline shows as $0 here, same as a refund or a block. EPC, earnings per click (Revenue divided by Clicks), is the unit-economics number that matters: an EPC above your average CPC means the slice prints money, below means it burns it.
Cost, ROI and cost per conversion (Campaign, Sub1 and Day)
Spend has a key of its own: campaign, UTC day and sub1. That is what makes the three money columns — Cost, ROI and Cost per conversion (FTD) — appear on the Campaign, Sub1 and Day slices, and what makes the date filter narrow spend the same way it narrows revenue.
Cost per conversion is Cost divided by FTD conversions — deliberately the same event the CR column counts, and the event is printed in the column header so the two numbers can never mean different things. A row with spend but no conversion yet shows a dash, not $0: the price is unknown, not zero.
Entering spend
Two ways, both by hand:
- In the cell. When the filters plus the row point at exactly one campaign and one day, the Cost cell becomes an input: on the Day slice pick one campaign, on the Sub1 slice pick one campaign and set both dates to the same day, on the Campaign slice set both dates to the same day. Type the amount, press Enter or click away; an empty cell deletes that spend row. Anywhere else the cell is read-only, because "save this number" would otherwise have to guess which day and which ad you meant.
- Enter spend. The button next to the filters takes rows pasted from your ad manager, one per line:
day, sub1, amount, orday, amountfor a day with no sub1 breakdown. Tab, semicolon and comma all work as separators, and a header line is skipped. With a tab or a semicolon,1 234,56and1,234.56are both read as 1234.56; with a comma, an amount that also contains a comma is refused rather than guessed (below). Lines that don't parse are listed with their line number and reason, and are not saved; the rest still are.
One case is refused rather than guessed: a comma-separated line whose amount also contains a comma — as the thousands separator (1,234.56) or as the decimal mark (1234,56, 1 234,56). 2026-08-30, 1,234.56 is equally "sub1 1, amount 234.56" and "amount 1234.56"; 2026-08-30, 1234,56 is equally "sub1 1234, amount 56" and "amount 1234.56". Both readings are legal, so the row is rejected with that reason instead of quietly storing a fraction of the money under an ad key you never typed. Separate the columns with a tab or a semicolon, or write the amount with a dot and no thousands separator. A comma-separated line that carries all three columns and a comma inside the amount (2026-08-30, creative-a, 1 234,56) splits into four fields and is refused as a column-count error — same remedy.
Per campaign and day, spend is stored either as one number with no sub1 breakdown or as per-sub1 rows — never both. Mixing them would count the day twice, so the second form is refused with a message instead of silently winning.
The dated spend cell reports a failed save (the field is marked invalid and carries the reason). The older per-campaign Cost cell — the one you get on the Campaign slice with no date filter — still rejects negative or non-numeric values silently: nothing saves and there's no message, so check for a stray character before assuming the request failed.
What the columns will not do
Geo and Offer slices have no Cost column at all, and that is a decision, not a gap. Nothing keys spend by country or by offer. The only way to print money there would be to spread the campaign's spend across rows in proportion to clicks — which is arithmetically the campaign's CPC divided by the row's CR, that is, a column carrying not one bit more than the CR column already shows while looking like a measured price. On real auctions, where creatives have different CPCs, it flatters the expensive ones and slanders the cheap ones, so it would push you to kill the ad that works.
A row can show spend with zero clicks: a creative that burned budget without producing a single tracked click still appears, because spend rows are matched by key rather than joined onto clicks. That row is the whole point — it is the money you cannot see anywhere else.
The Total row is computed over the whole slice by the server, not over the 500 rows on screen, and the page says so when the slice is longer. Total Cost can also exceed the sum of the Cost column: spend entered for a day without a sub1 breakdown is real money that the Sub1 slice cannot attribute to any one ad. The page explains that in a line under the table rather than quietly showing two different numbers.
The older per-campaign Cost
Cost used to be a single lifetime number on the campaign with no date attached. It still exists, and on the Campaign slice with no date filter it behaves exactly as before — the report covers all time there, so a lifetime number is the period's spend. As soon as you filter by date, that number is no longer shown or edited: it never belonged to the days you picked. Enter dated spend for those days and the column fills back in, this time honestly.
Raw analysis: the clicks CSV
When four dimensions aren't enough (you want sub2 by geo, or an hour-level cut), go to Clicks, set the same filters (status, campaign, date range, search) and hit Export CSV. The export fetches every matching row, not just the visible page, with columns id, campaignId, sub1, sub2, sub3, geo, status, createdAt. Pivot it in Sheets or a notebook however you like.
Common pitfalls
- Dated spend is what makes ROI true under a date filter. Until you enter spend per day, filtering the report to last week gives you last week's Revenue next to an empty Cost — a dash, on purpose, rather than the old lifetime number that had nothing to do with those seven days.
- Dates are UTC — for spend too. The day you type in a spend row is a UTC day, so "yesterday" in your ad account's timezone is not necessarily the day the report will put it in; align the timezones before comparing.
- The Total row covers the whole slice, so on a report longer than 500 rows it is legitimately larger than the sum of the rows you can see.
- Revenue stays at $0 until a conversion carries a
payoutand its billing status lands onchargedorfree. Zero EPC on a converting campaign can be an integration gap, but it can also just be an event sitting inpendingorerrorwhile billing catches up, so check the payout and billing status before you assume the funnel is broken. - A "—" row shows up wherever the current dimension has no value: no campaign, no geo, or no sub1. It's real traffic, so don't ignore it, and in the Campaign dimension you won't be able to give it a Cost.